Chapter 9: Map
In this chapter we’ll show you how to use some of the more advanced features and techniques in Gameface to create a map. We’ll look at how to make a large tiled map that can be moved around with the mouse and zoomed in and out. The map will also have a custom cursor and points of interest that will show the relevant information when hovered over. All of this will be achieved through data-binding.
Adding a new model for the map
As with all previous chapters, we will start by adding data to our model. This time however we’ll make a new model for the map as we’ll be updating the model every time we interact with the map. If we keep everything in a single model we are risking performance issues as the model grows bigger.
We’ll start by creating a new map object with the following values - zoom, x, y, pointsOfInterest and mapTiles.
const map = {
    zoom: 1,
    x: 0,
    y: 0,
    pointsOfInterest: [],
    mapTiles: Array.from(Array(64))
}
Then in our whenReady promise resolve, we’ll register the new model next to our PlayerModel and we also need to make sure it’s before the engine.synchronizeModels
engine.createJSModel("MapModel", map);
While all of the values are pretty self explanatory, the mapTiles seems out of place as it’s just an array of empty values. While it is indeed not necessary to have this value, we’ll be using it to avoid having to manually set up each map tile. The tiles we have provided in the assets folder are for an 8 x 8 map, or 64 tiles in total. So instead of having to write an element for each tile, we can now easily write one with data-bind-for and create all 64 tiles at once.
Adding a grid of tiles
To do that we’ll use another component called automatic-grid, which will allow us to create an 8x8 grid easily. To install it, we’ll do the same thing we did in Chapter 6 and use the node package manager. For this particular component we’ll also need to use the grid component style as it’s built on top of it.
To install both components we’ll use:
npm install coherent-gameface-automatic-grid
npm install coherent-gameface-grid
And then in our index.html we’ll add the style for the grid and the automatic-grid.
<link rel="stylesheet" href="./node_modules/coherent-gameface-grid/style.css">
<link rel="stylesheet" href="./node_modules/coherent-gameface-automatic-grid/style.css">
Plus the script for the automatic-grid:
<script src="./node_modules/coherent-gameface-automatic-grid/dist/automatic-grid.production.min.js"></script>
To create our automatic grid, we just need to add the automatic-grid element to our html. Before that, however, we need to create a new tab, just like we did for the inventory and settings:
<div class="tab" data-bind-class-toggle="active-tab:{{PlayerModel.activePauseMenu}} === 'map'">Map</div>

<div class="map" data-bind-if="{{PlayerModel.activePauseMenu}} === 'map'">

</div>
And then we’ll add:
<div class="map" data-bind-if="{{PlayerModel.activePauseMenu}} === 'map'">
     <gameface-automatic-grid class="map-tile-grid"></gameface-automatic-grid>
</div>
To set the columns and rows in our automatic-grid we just need to add them as attributes to our automatic-grid element like this:
<gameface-automatic-grid class="map-tile-grid" columns="8" rows="8">

</gameface-automatic-grid>
With this we now have an 8x8 grid. But we still need to add the map tiles to it, for which we’ll use a component-slot element. Component-slot elements are elements that are added as children to the component and are then used in the component template based on their data-name attribute. Here, we’ll need a component-slot with a data-name=”item”
<gameface-automatic-grid class="map-tile-grid" columns="8" rows="8">
    <component-slot data-name="item"></component-slot>
</gameface-automatic-grid>
And inside this component slot we can add our map tile:
<component-slot data-name="item">
    <div class="map-tile"></div>
</component-slot>
But we have 64 tiles and we don’t want to write a component slot for each one of them. Instead, we’ll use the mapTiles we added to our model and by using data-bind-for, we’ll create 64 of those component slots
<component-slot data-name="item" data-bind-for="index, tile: {{MapModel.mapTiles}}">
We now have 64 tiles that will be arranged in an 8x8 grid. But we still don’t have the images for them. This can be easily fixed by adding a data-bind-style-background-image-url just as we did in the previous chapter:
<div class="map-tile" data-bind-style-background-image-url="'./assets/map-1_'+ ({{index}} + 1) +'.jpg'"></div>
where we need index + 1 because the map tiles start from 1, but the index starts with 0 and to indicate that it’s a number, otherwise it will be resolved to - “./assets/map-1_01.jpg”
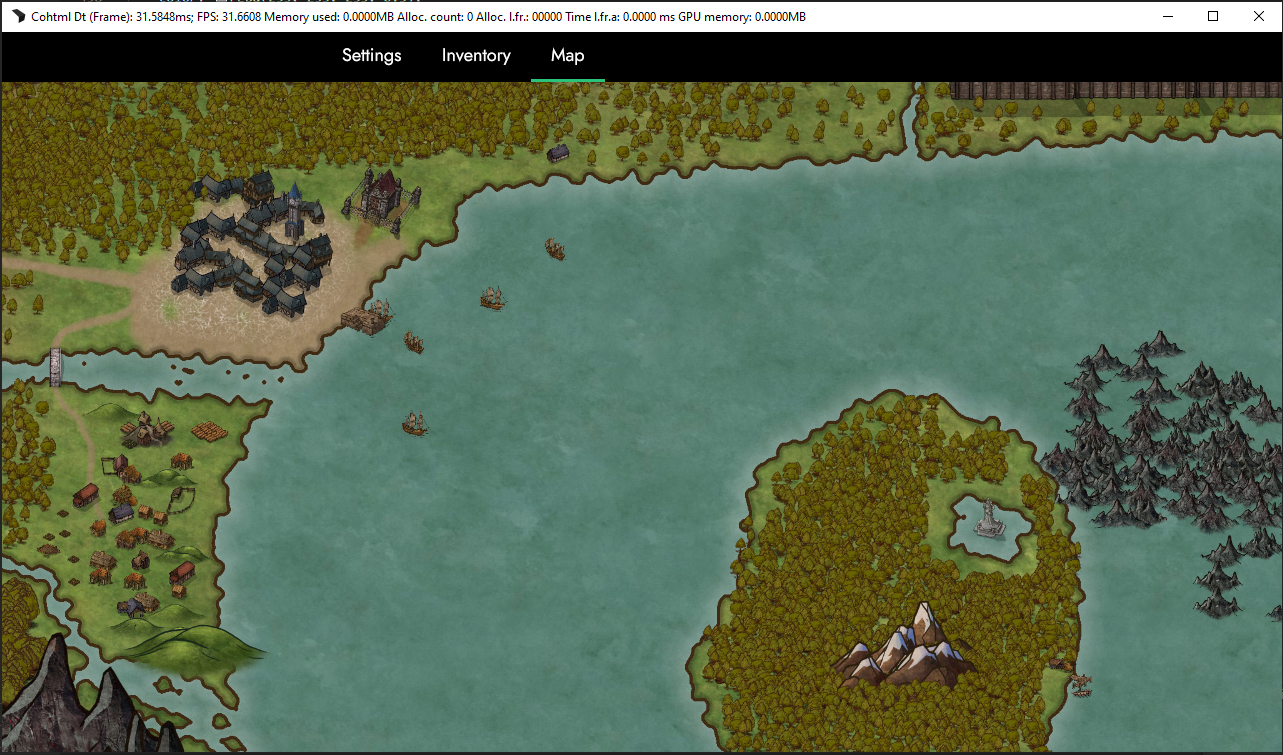
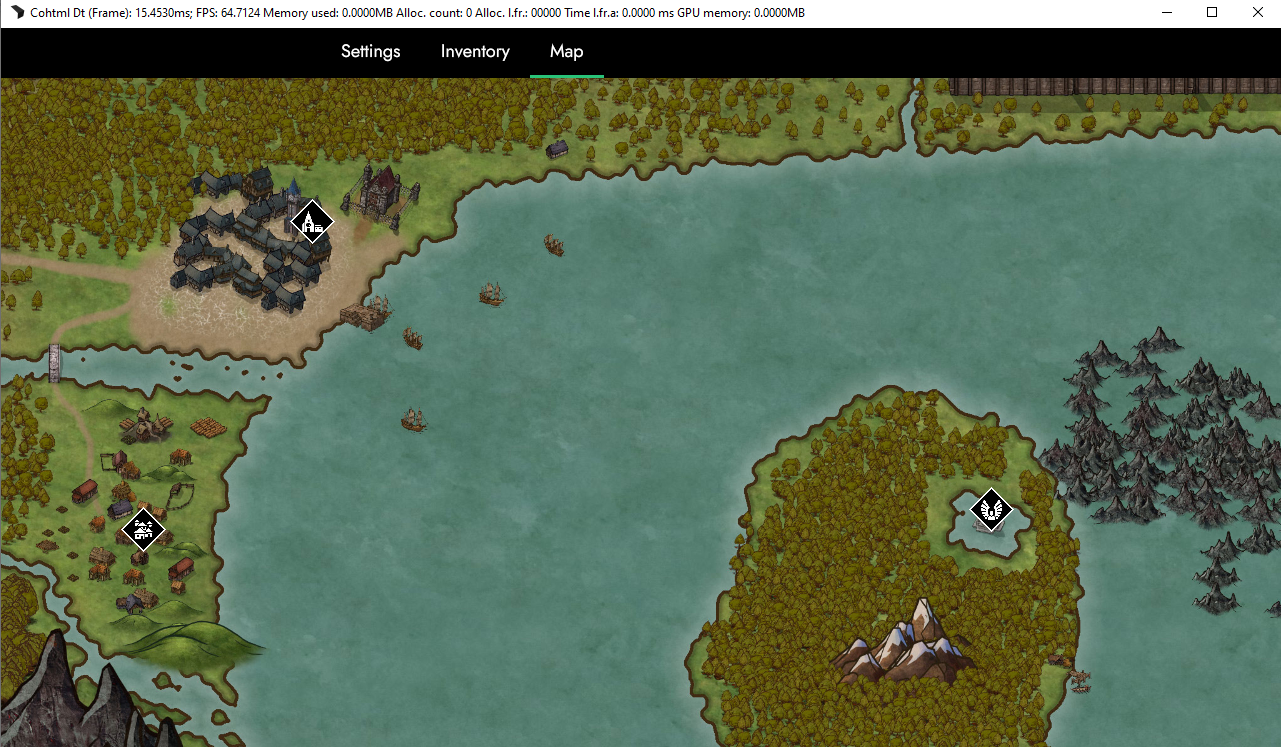
If we open the Player, we’ll see the map displayed:
Add interactivity to the map
Our next step is to make the map more interactive by attaching an event listener and moving it around by dragging. Since we also want to be able to zoom in and out, we’ll be using a single data-binding to achieve both. This can be done with data-bind-style-transform2d, which accepts a matrix of 6 numbers in the following order: scaleX(), skewY(), skewX(), scaleY(), translateX(), translateY(). For our case, we’ll be needing scaleX and Y and translateX and Y.
To get started we’ll create a function called mapDragStart() in our script.js and attach it on mousedown to our map:
function mapDragStart(event) {

}
<div class="map" onmousedown="mapDragStart(event)" data-bind-if="{{PlayerModel.activePauseMenu}} === 'map'">
If we click on the map now nothing will happen, as the function we attached is empty. Before we start adding some logic to it, let’s add the data-binding to our automatic-grid, as the map will only serve as a container. Since we only need a few transforms, our data-bind-style-transform2d will look something like this:
<gameface-automatic-grid class="map-tile-grid" columns="8" rows="8" data-bind-style-transform2d="{{MapModel.zoom}} + ', 0, 0,' + {{MapModel.zoom}} + ',' + {{MapModel.x}} + ',' + {{MapModel.y}}">
It may look a bit confusing, but the transform2d binding expects a string, so we must concatenate our values to be a string. If we open the Player we should see that nothing has changed.
Next, we need to create two more functions - mapDrag (which will control the dragging) and mapDragEnd (which will clear any changes we made so as to not interfere with the other operations).
function mapDrag(event) {

}
function mapDragEnd() {

}
Once these are in place, we can attach them to our event listeners. However, unlike with the mousedown event, we’ll be attaching these to the document in order to have the map drag even while we go outside. This will allow us to not set a flag that we are dragging the map. So in the mapDragStart we’ll add the following:
function mapDragStart(event) {
    document.addEventListener('mousemove', mapDrag);
    document.addEventListener('mouseup', mapDragEnd);
}
And in the mapDragEnd function we’ll remove these listeners, so that we stop dragging when the mouse button is released:
function mapDragEnd() {
    document.removeEventListener('mousemove', mapDrag);
    document.removeEventListener('mouseup', mapDragEnd);
}
If we now drag the map in the Player nothing will happen, as we haven’t added any code to our function to be executed. To start we’ll actually add a few global variables, namely offsetY (the offset of our map because of the tabs) startX and startY which will allow us to drag the map based on the starting position of the drag:
let offsetY, startX, startY;
We’ll set these variables in the mapDragStart function :
function mapDragStart(event) {
    offsetY = event.currentTarget.getBoundingClientRect().y;

    startX = event.clientX;
    startY = event.clientY - offsetY;

    document.addEventListener("mousemove", mapDrag);
    document.addEventListener("mouseup", mapDragEnd);
}
And in the mapDrag function we’ll use these variables to change the model and create the dragging motion:
function mapDrag(event) {
    MapModel.x += event.clientX - startX;
    MapModel.y += event.clientY - startY - offsetY;

    startX = event.clientX;
    startY = event.clientY - offsetY;

    engine.updateWholeModel(MapModel);
    engine.synchronizeModels();
}
Here we add to the model the difference between the starting coordinates and the mouse coordinates - that way, if we move the mouse to the left, we’ll receive a negative number (and so on). We then set the new starting points, so on the next move we’ll only add the distance that the mouse has moved. Lastly, we have to update the model and synchronize it in order for all of these changes to appear on screen.
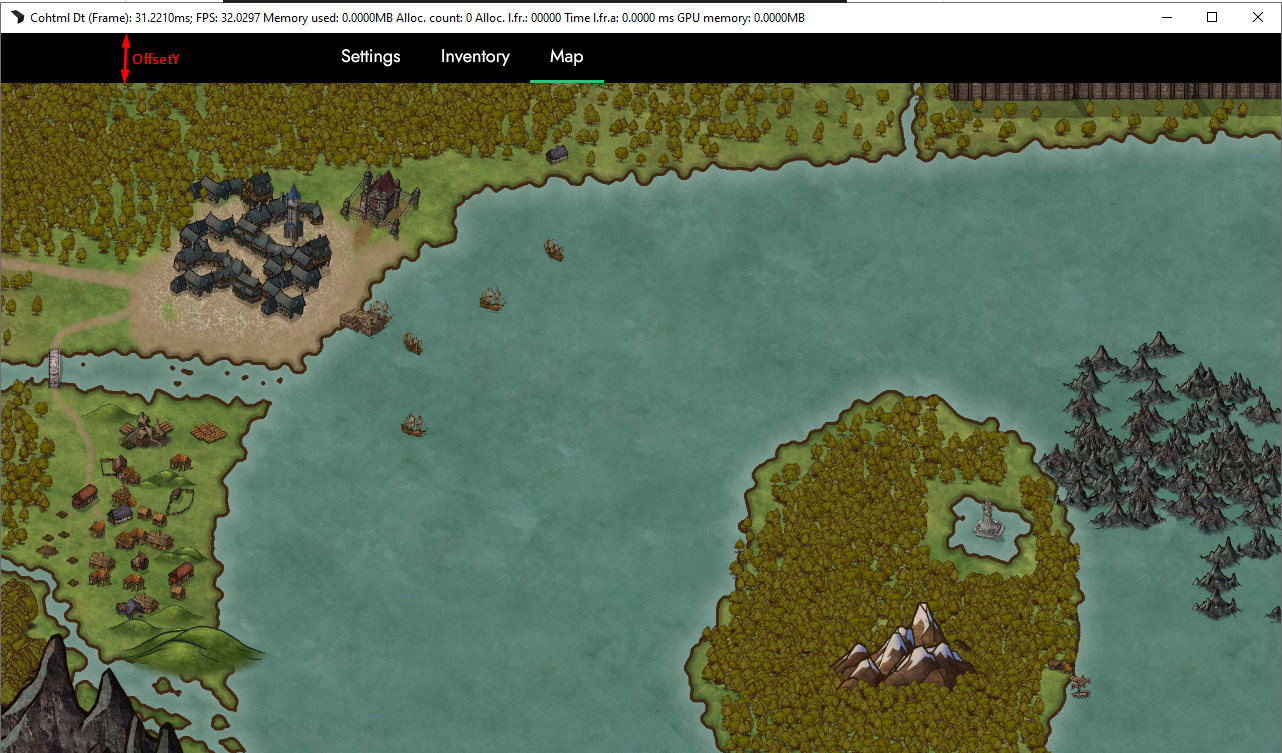
If we open the Player and drag our map we’ll see it move:
But as we can see, our map can be dragged infinitely, meaning that we can remove it entirely from the map. To fix that we’ll need to make another two global variables - limitX and limitY, which we’ll use to control the dragging. And in the mapDragStart function we’ll do the following:
    const mapWrapper = event.currentTarget;
    const map = event.currentTarget.firstChild;

    offsetY = mapWrapper.getBoundingClientRect().y;

    limitX = (map.getBoundingClientRect().width - mapWrapper.getBoundingClientRect().width) / 2;
    limitY = (map.getBoundingClientRect().height - mapWrapper.getBoundingClientRect().height) / 2;
where we have added a constant, so that we don’t have to write event.currentTarget and event.currentTarget.firstChild everywhere.
This limit is the difference between the width/height of the map and the width/height of the wrapper divided by two (that way we can drag the map to the left as well as to the right, up and down, respectively).
To add the limits, we’ll just clamp the model values. Clamping is a way to limit a value between two others - a min and max value. To make the clamping, we’ll make a helper function called clamp() in the script.js file, which will take on a value, a minimum and maximum value:
function clamp(value, min, max) {
    return Math.min(Math.max(min, value), max);
}
And in the mapDrag function:
MapModel.x = clamp(MapModel.x + event.clientX - startX, -limitX, 0);
MapModel.y = clamp(MapModel.y + event.clientY - startY - offsetY, -limitY, 0);
If we drag the map now it won’t move past the edges.
The next kind of functionality we will give the map is the ability to zoom in and out using the mouse scroll. To do that, we’ll make another function called zoom and attach it to the wheel event of our map:
function zoom(event) {

}
<div class="map" onmousedown="mapDragStart(event)" onwheel="zoom(event)" data-bind-if="{{PlayerModel.activePauseMenu}} === 'map'">
We can now start adding the zoom logic to our function. For our use case, we need the map to zoom in on our mouse coordinates - there are a couple of ways to do that, but we are going to do it by moving the x and y coordinates of the map, based on the scale.
We’ll start by changing the scale of our map based on the mouse wheel movement. To do that we’ll be using the deltaY of our event and multiply it by -0.01 (The delta is always 40 and it will be too large of a scale; the reason why it’s a negative number is that the delta is negative when you scroll up and positive when down. If we don’t reverse them, we’ll have to scroll down to zoom out and vice versa, which is very counterintuitive). Since we don’t want to scale the map to be infinitely small, we’ll reuse the clamping function we made earlier:
MapModel.zoom = clamp(MapModel.zoom + (event.deltaY * -0.01), 1, 3);
If we now try to zoom in on any point in our map, we’ll see that it zooms in and out based on the top left corner where our origin point is located. Аs mentioned previously, to fix that we’ll change the x and y coordinates of the map.
The first thing we’ll add to our code are the map constants from the mapDragStart function
    const mapWrapper = event.currentTarget;
    const map = event.currentTarget.firstChild;
Then we’ll set the offsetY again ( if we start to zoom without having dragged the map, our calculations will be off)
offsetY = mapWrapper.getBoundingClientRect().y;
And then save the initialScale of the map:
const initialScale = MapModel.zoom;
We need to save the initial scale because when we scale an element, it scales based on its initial values. For example, if we have a square that is 100x100 and we scale it twice, it will become 200x200; however, if we change the scale to be 4, it won’t become 800x800 but 400x400 (hence we’ll need this value to compensate for the difference).
After that comes the zoom logic we wrote earlier; once set, we can proceed with setting our limits:
    MapModel.zoom = clamp(MapModel.zoom + event.deltaY * -0.01, 1, 3);

    limitX = map.getBoundingClientRect().width * (MapModel.zoom / initialScale) - mapWrapper.getBoundingClientRect().width;
    limitY = map.getBoundingClientRect().height * (MapModel.zoom / initialScale) - mapWrapper.getBoundingClientRect().height;
As you can see, setting the limits is the same as in the mapDragStart function, but with an addition. When we set the limits, we haven’t yet updated and synchronized the model - this means that the map width is not scaled to the new scale yet. To compensate for this difference, we’ll divide the new scale by the old one and multiply it by the width of the map, so we can get scaled width. Same goes for the height.
With the limits set, we can set the new map x and y coordinates:
MapModel.x = clamp(MapModel.x + event.clientX * (MapModel.zoom - initialScale) * -1, -limitX, 0);
MapModel.y = clamp(MapModel.y + (event.clientY - offsetY) * (MapModel.zoom - initialScale) * -1, -limitY, 0);
Again, we have a slight difference to the mapDragStart and mapDrag functions. We have to compensate for the scale again, by subtracting the current scale to the old scale, then multiplying by -1. The purpose of the multiplication is to have the map move in the correct direction.
And then we finish by updating and synchronizing our model:
    engine.updateWholeModel(MapModel);
    engine.synchronizeModels();
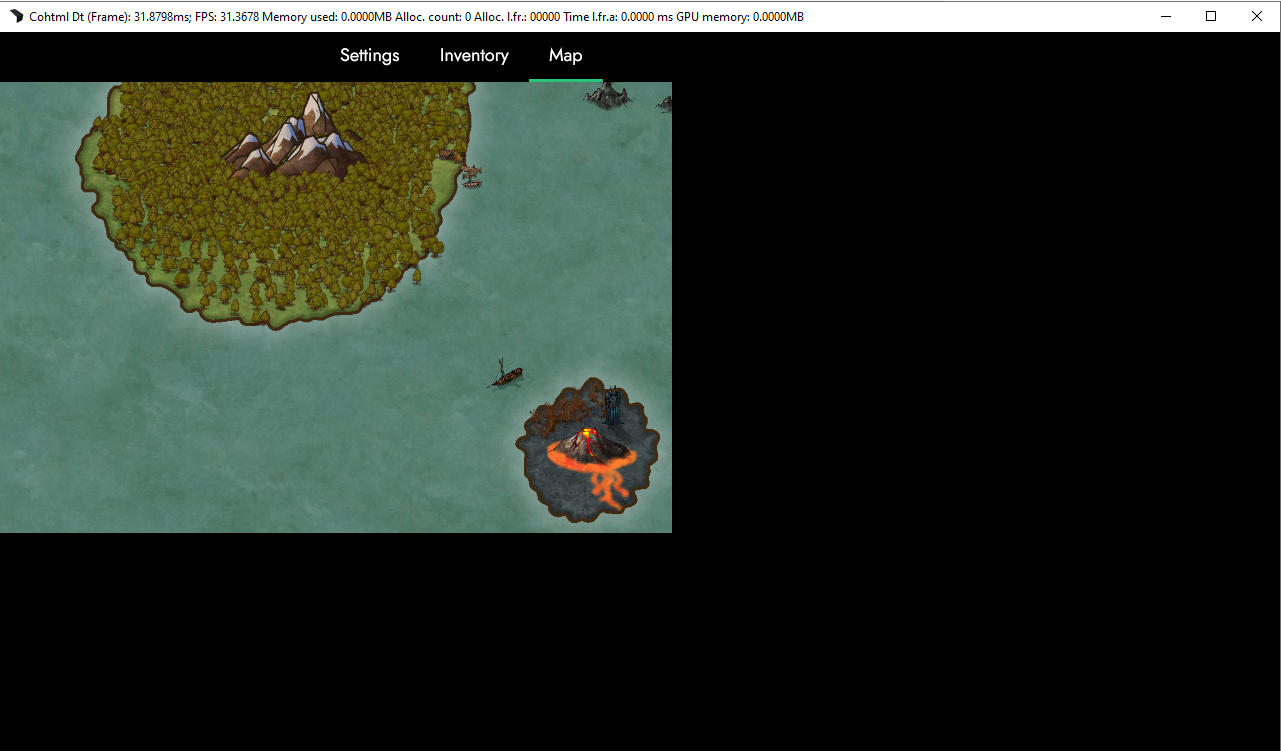
Now when we open the Player we’ll see that we can zoom in and out in the map using the mouse scroll:
Adding Point Of Interest markers to the map
With that done we can move to the last component of our map, the points of interest. These will be markers on the map, that when hovered over will show a tooltip with more information about the point. We can do this by combining a couple of different data-bindings, but in this case we’ll demonstrate how to create your own data-binding attribute and use it.
To start we’ll create a new file, called poi-data-binding.js and we’ll include it in the index.html between the cohtml script and the model.js file:
    <script src="./cohtml.js"></script>
    <script src="./poi-data-binding.js"></script>
    <script src="./model.js"></script>
We can now start making our custom data-binding attribute. The first thing we need to do is to make a class in the poi-data-binding file we just created which we’ll call POIHandler (the names of the files and classes are arbitrary, you can set them to anything that make sense to your use case)
class POIHandler {

}
Inside this class we always need to add 3 functions - init, update and deinit. These functions receive our model value and allow us to control what happens with the custom data-binding. The init function runs the first time we attach the custom data-binding, the update function - each time the model changes, and the deinit is when we remove the data-binding.
Each function accepts the following parameters:
    init(element, value) {

    }

    update(element, value) {

    }

    deinit(element) {

    }
where element is the element we have added our custom data-binding attribute to and value is the value of our model.
The first thing we need to do is to decide on the type of data our custom data-binding will work with. In our case, these will be objects that have x and y coordinates, image, title, description and an indication if it’s locked.
In our MapModel in pointsOfInterest we’ll add a couple of objects:
	pointsOfInterest: [
		{
			x: 10.3004,
			y: 45.7164,
			icon: 'village',
			title: 'Village',
			description: 'The village where you were raised.',
			locked: false
		},
		{
			x: 22.6609,
			y: 14.1493,
			icon: 'town',
			title: 'Town',
			description: 'The town of Málhildur.',
			locked: false
		},
		{
			x: 74.9957,
			y: 42.1492,
			icon: 'statue',
			title: 'Statue of Freya',
			description: 'Statue of the goddess Freya. Only thing left from a sunken village.',
			locked: true
		}
	],
Now we can start making our tooltips. To start, we’ll create a couple of additional functions in the poi-data-binding:
    createTooltip(title, description, locked) {

    }

    onMouseEnter() {

    }

    onMouseLeave() {

    }
The createTooltip will create the tooltip that will show when we hover over a POI and the onMouseEnter and onMouseLeave will be responsible for showing and hiding the tooltip.
We can now start adding logic to our init function and set the position and images of our points:
    init(element, value) {
        element.parentNode.style.left = `${value.x}%`;
        element.parentNode.style.top = `${value.y}%`;
        element.style.backgroundImage = `url(./assets/map-${value.icon}-icon.png)`;
    }
As you can see we are adding the position to the poi parent, rather than the element. This is because, we need to separate the element with the data-bind-for from the other data-binded elements as the order of evaluations might be incorrect, but we need to change it’s position, rather than the childs.
Let’s test if everything we’ve done so far works. We’ll first need to register our custom data-binding attribute. In the model.js file (in the engine.whenReady, above the part where we register our model), we’ll add the following:
engine.registerBindingAttribute('poi', POIHandler);
We can now use our custom data-binding attribute as: data-bind-poi.
Before we use it, we need to make a few structural changes to our html. In the index.html, we’ll wrap the automatic-grid in a new div that will have the same class and data-binding as the grid:
<div class="map-tile-grid"
     data-bind-style-transform2d="{{MapModel.zoom}} + ', 0, 0,' + {{MapModel.zoom}} + ',' + {{MapModel.x}} + ',' + {{MapModel.y}}">
     <gameface-automatic-grid columns="8" rows="8">
               <component-slot data-name="item" data-bind-for="index, tile: {{MapModel.mapTiles}}">
                     <div class="map-tile" data-bind-style-background-image-url="'./assets/map-1_'+ ({{index}} + 1) +'.jpg'"></div>
               </component-slot>
      </gameface-automatic-grid>
</div>
This will allow us to place our points of interest relative to the grid, so that when we make any changes (e.g. scale, move), it will affect them as well.
We can now add a .point-of-interest-container element inside the map-tile-grid; using data-bind-for, we’ll multiply it to the number of points in our model and then we’ll add a .point-of-interest our custom data-binding should position it correctly on the map:
<div class="point-of-interest-container" data-bind-for="poi:{{MapModel.pointsOfInterest}}">
	<div class="point-of-interest"  data-bind-poi="{{poi}}"></div>
</div>
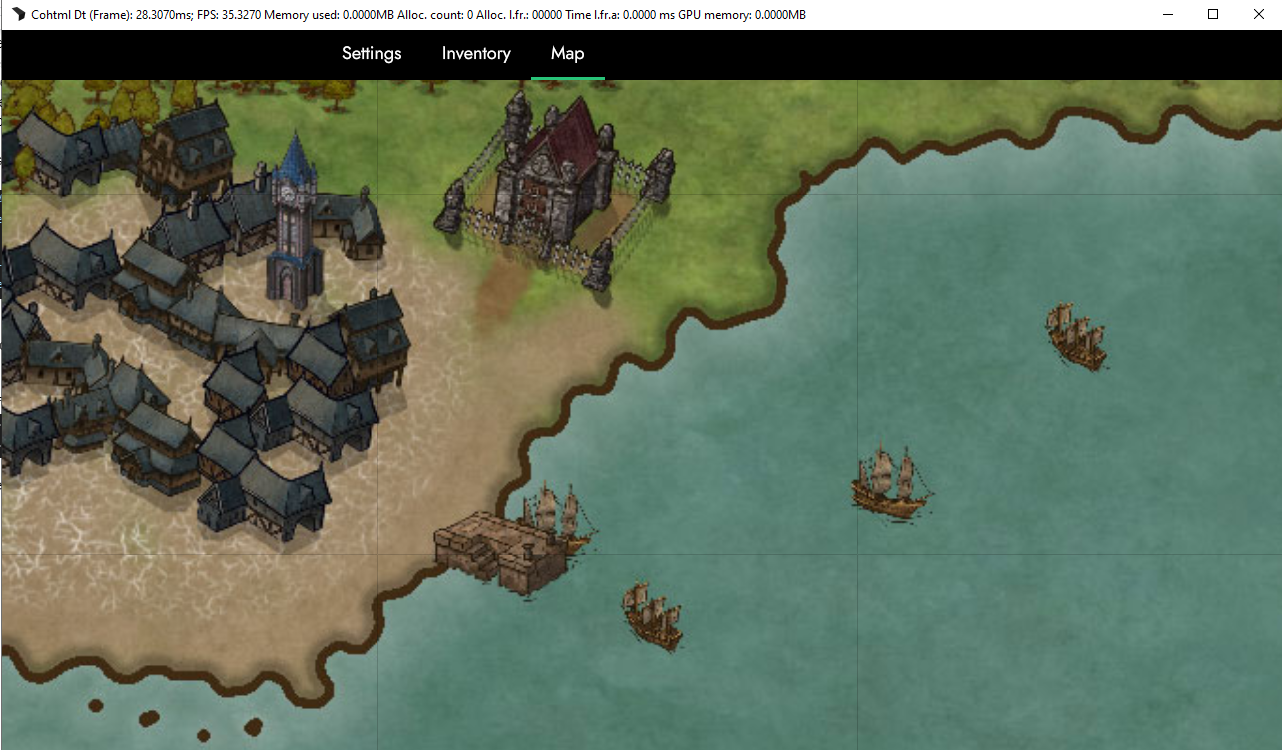
If we open the Player, we should see the icons positioned correctly:
Next we’ll add a tooltip and event listeners that will show or hide the tooltip if we hover over the icon. In the poi-data-binding.js we’ll add the following code to the createTooltip function
    createTooltip(title, description, locked) {
        const tooltip = document.createElement("div");
        tooltip.classList.add("tooltip");
        tooltip.innerHTML = `<div class="tooltip-title">${title}</div><div class="tooltip-description">${description}</div>`;
        return tooltip;
    }
And in our init function, we can add the following code:
this._tooltip = this.createTooltip(value.title, value.description, value.locked);
This will make the tooltip available in other functions as well - namely the onMouseEnter and onMouseLeave.The reason why we don’t add it to the init function is that the update function always fires on synchronizeModels, hence we don’t need to run it twice.
With our tooltip created, we can append it to our element.
element.appendChild(this._tooltip);
Then in the update function we need to update the tooltip with the new data, whenever it has been updated. We also :
this._tooltip.innerHTML = `<div class="tooltip-title">${value.title}</div><div class="tooltip-description">${value.description}</div>`;
Now, we can attach our event listeners to the element in the init function, and remove them in the deinit:
    init(element, value) {
        element.style.left = `${value.x}px`;
        element.style.top = `${value.y}px`;
        element.style.backgroundImage = `url(./assets/map-${value.icon}-icon.png)`;

        this._tooltip = this.createTooltip(value.title, value.description, value.locked);
        element.appendChild(this._tooltip);

        element.addEventListener('mouseenter', this.onMouseEnter);
        element.addEventListener('mouseleave', this.onMouseLeave);
    }

    deinit(element) {
        element.removeEventListener('mouseenter', this.onMouseEnter);
        element.removeEventListener('mouseleave', this.onMouseLeave);
    }
And in the onMouseEnter and onMouseLeave functions we can add:
    onMouseEnter() {
        this._tooltip.style.display = 'block';
    }

    onMouseLeave() {
        this._tooltip.style.display = 'none';
    }
If we open the Player and hover over the point of interest, we won’t see anything; alternatively, if we open the logs, we’ll see an error. The reason is that inside the onMouseEnter and onMouseLeave functions, this points to a different object. To fix that we need to create constructor function and add the following:
    constructor() {
        this.onMouseEnter = this.onMouseEnter.bind(this);
        this.onMouseLeave = this.onMouseLeave.bind(this);
    }
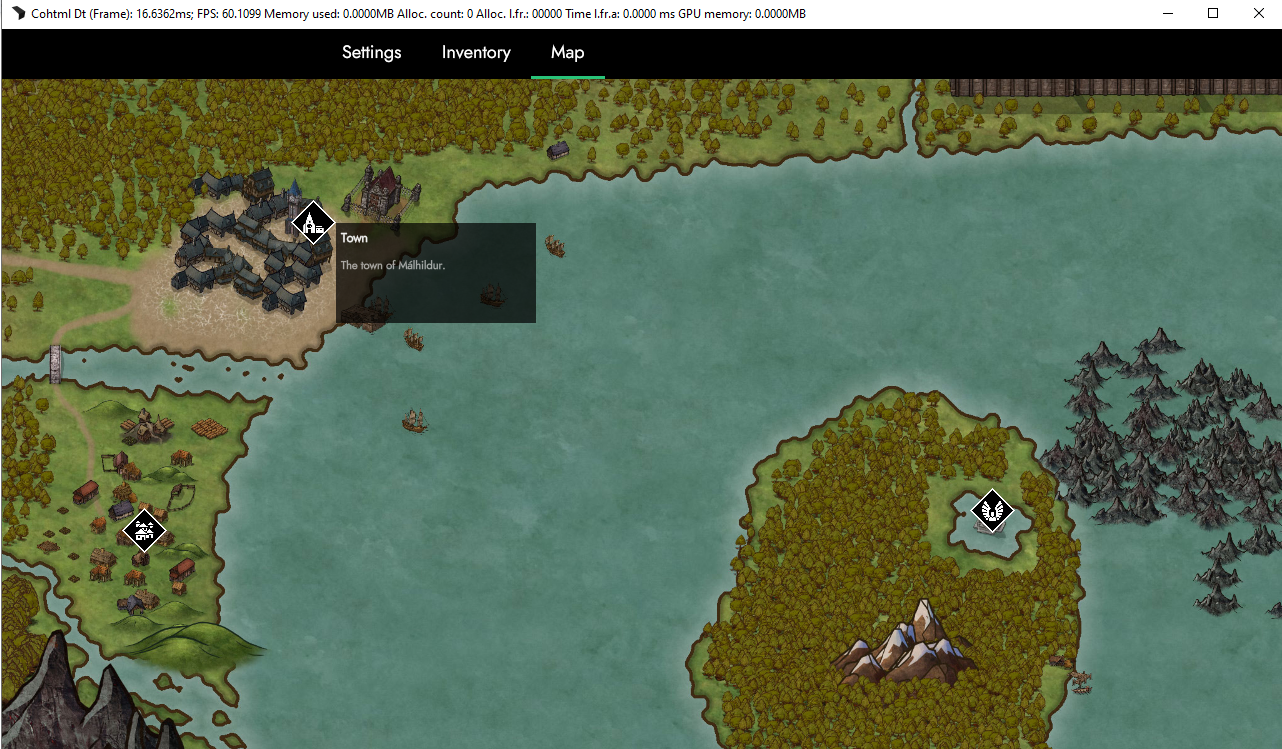
If we try this now, the tooltips will appear.
But what about the locked flag we added to our model? We can use this to lock a POI, show a different icon and not display the tooltip. To do this, we’ll change where we set the icon inside the init function:
element.style.backgroundImage = `url(./assets/map-${!value.locked ? value.icon : 'locked'}-icon.png)`;
We’ll also change the code of the createTooltip function to be:
    createTooltip(title, description, locked) {
        const tooltip = document.createElement("div");
        if (!locked) {
            tooltip.classList.add("tooltip");
            tooltip.innerHTML = `<div class="tooltip-title">${title}</div><div class="tooltip-description">${description}</div>`;
        }
        return tooltip;
    }
And inside the update function we need to add the following check so that whenever we update the model data, the poi doesn’t fill the tooltip.
if (value.locked) return;
The last thing to complete is to change some of the points of interest in our model to be locked, like the statue for example:
{
   x: 968,
   y: 409,
   icon: 'statue',
   title: 'Statue of Freya',
   description: 'Statue of the goddess Freya. Only thing left from a sunken village.',
   locked: true
}
And in the Player:

With that we can now wrap up this chapter. In the final chapter, we’ll go over the ways to debug and profile your app.
Get the chapter files
You can download the completed chapter from here